Unexpected equipment failures can be expensive and potentially catastrophic, resulting in unplanned production downtime, costly replacement of parts and safety and environmental concerns. With many factories and process control plants facing an ever-increasing shortage of experienced personnel, many are now looking for AI based systems to replace the ‘experienced old guy’ who knows everything about the machine and reduce their Total Cost of Ownership (TOC).
The challenge is however, how do you build and train an AI CbM system to replace an expert ?
What is CbM?
As part of the I4.0 revolution, Condition based monitoring (CbM) of machines has received a great amount of attention, as factories look to maximise their production efficiency and reduce their TOC, while at the same time retaining the invaluable skills of experienced foremen and production workers. As such, CbM is a process for monitoring equipment during operation to identify any deterioration, enabling maintenance to be planned and operational costs reduced.
CbM 5G edge computing
Many are factory owners are suspicious of cloud-based enterprise solutions offered by Microsoft, Amazon and Google as data leaves the site and any latency issues could affect production output. Recently 5G edge computing has received much attention, whereby all time-critical operations are undertaken at the edge (i.e. near to the asset in the factory) via smart sensors.
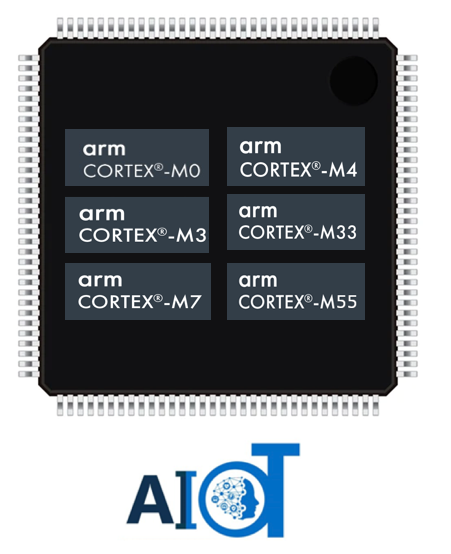
Arm’s rich set of Cortex processors offer a combination of high performance, ML/DSP computation support and low power. This is further strengthened by Arm’s new Helium Cortex-M55 and Cortex-M85 AI based processors that have been specially designed for edge-based AI applications – the latter offers an impressive 3DMIPS/MHz making it a good fit for ML and DSP algorithms. These processors and supporting libraries now allow developers to develop high-performance CbM smart sensors to perform their computationally intensive tasks at the edge and communicate the results via a 5G network to a smartphone or database. This provides higher reliability and scalability than expensive cloud-based solutions reliant on big data.
It would seem that big data has had its day!
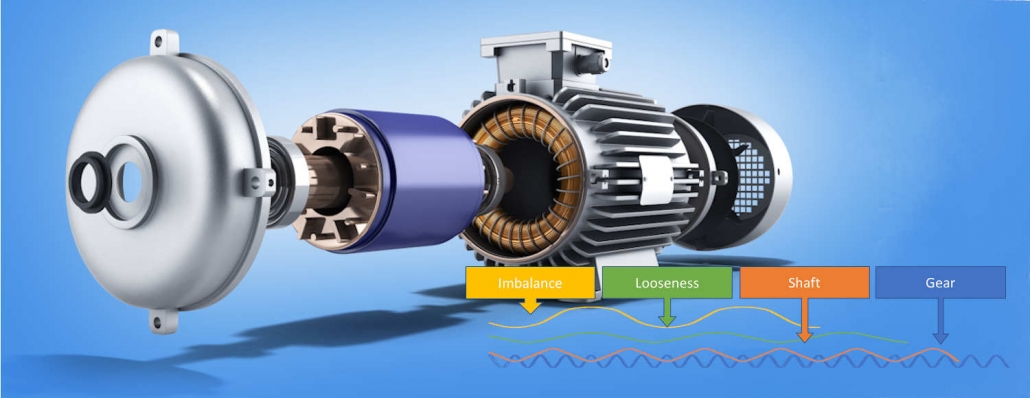
Vibration sensor technology
Contactless MEMS (microelectromechanical systems) accelerometers sensors are an excellent alternative to the well-established, but bulky and expensive (25-500+ EUR) Piezo sensors for obtaining vibration information. MEMS sensors are relatively low cost (10-30 EUR) and can offer a response down to DC (zero Hertz), which is useful for the detection of imbalance at very low rotational speeds. MEMS accelerometers also have a self-test feature whereby the sensor can be verified to be 100% functional. They produce acceleration data that can be analysed by various vibration monitoring algorithms.
Spectral vibration monitoring via the FFT (Fast Fourier Transform) is regarded as an industry standard for machine vibration analysis. If a mechanical problem exists, the FFT spectra (multiple spectrums) will provide information to help determine the source and cause of the problem. Coupled with the right AI algorithms, the features from the FFT analysis can be used to identify the root cause of the failure, such as motor imbalance, misalignment, and looseness. These properties and challenges faced by the FFT will be discussed further later on in the article.
There are several steps to follow as guidelines to help achieve a successful vibration monitoring programme. The following is a general list of these steps:
- Collect useful information: Look, listen and feel the machinery to check for resonance. Identify what measurements are needed (point and point type). Conduct additional testing if further data are required.
- Analyse spectral data: Evaluate the overall values and specific frequencies corresponding to machinery anomalies. Compare overall values in different directions and current measurements with historical data.
- Multi-parameter monitoring: Use additional techniques to conclude the fault type. (Analysis tools such as phase measurements, current analysis, acceleration enveloping, oil analysis and thermography can also be used.)
- Perform Root Cause Analysis (RCA): In order to identify the real causes of the problem and to prevent it from occurring again.
- Reporting and planning actions: Use a Computer Maintenance Management System (CMMS) to rectify the problem and take action to achieve a plan.
Getting acceleration, velocity and/or displacement estimates
As aforementioned, a popular device used to obtain acceleration data is a so-called ‘accelerometer’. These devices are semiconductor-based MEMS (microelectromechanical systems) and provide 3D (i.e. tri-axial) acceleration time domain data to a supporting microcontroller.
Before FFT analysis, the accelerometer data is usually passed through integration signal processing blocks, in order to convert the time domain acceleration data into velocity and displacement data. These blocks are comprised of a highpass filter and cumulative sum (integration). The highpass filter is essential for removing the effects of DC and noise, which would cause an offset in the output (i.e. the result of the integration). Depending on the severity of the noise/DC the output may even saturate, making it unusable for analysis. The design of a suitable highpass filter is an extremely challenging task and is the primary reason why many vibration analysis systems struggle to measure vibrations <10Hz (600 RPM).
Collect useful information
When conducting a vibration program, certain preliminary information is needed in order to conduct an analysis. The identification of components, running speed, operating environment and types of measurements should be determined initially to assess the overall system.
Identify components of the machine that could cause vibration
Before a spectrum can be analysed, the components that cause vibration within the machine must be identified. For example, you should be familiar with these key components:
- If the machine is connected to a fan or pump, it is important to know the number of fan blades or impellers.
- If bearings are present, know the bearing identification number or its designation.
- If the machine contains, or is coupled, to a gearbox, know the number of teeth and shaft speeds.
- If the machine is driven with belts, know the belt lengths.
The above information helps assess spectral components and helps identify the vibration source. Determining the running speed is the initial task. There are several methods to help identify this parameter.
Identifying the running speed
Knowing the machine’s running speed is critical when analysing an FFT spectrum. Running speed is related to most components within the machine and therefore, aids in assessing overall machine health. There are several ways to determine running speed:
- Read the speed from instrumentation at the machine or from instrumentation in the control room monitoring the machine.
- Look for peaks in the spectrum at 1,800 or 3,600 RPM (60Hz countries), 1,500 and 3,000 RPM (50Hz countries) if the machine is an induction electric motor, as electric motors usually run at these speeds. If the machine is variable speed, look for peaks in the spectrum that are close to the running speed of the machine during the time at which the data is captured.
- An FFT’s running speed peak is typically the first significant peak in the spectrum when reading the spectrum from left to right. Search for this peak and check for peaks at two times, three times, four times, etc. (at the harmonic frequencies).
Challenges with the FFT algorithm
FFT spectra allow us to analyse vibration amplitudes at various component frequencies on the FFT spectrum. In this way, we can identify and track vibration occurring at specific frequencies. Since we know that particular machinery problems generate vibration at specific frequencies, we can use this information to diagnose the cause of excessive vibration.
Challenges with spectral analysis
- The sampling rate of the accelerometer drifts with temperature: This results in a mismatch between the FFT analysis sampling frequency and the real situation. As such, the amplitude and frequency estimates of the vibration will be incorrect.
- Frequency resolution: the frequency of the vibration peak may have a fractional value. If the resolution of the Fourier algorithm is not fine enough, it will ‘smear’ the result, resulting in a lower amplitude estimate.
- Running speed: this is typically known apriori, but will have a degree of error associated with it and will change with temperature. For example, 3000 rpm ±1% is 50Hz ±0.5Hz at the fundamental running frequency. In order to track higher harmonics (i.e. multiples of the running speed) the FFT must have sufficient frequency resolution to accurately estimate the amplitude at the right frequency.
Traditional FFT based analysis uses a very high number of computational points in order to achieve a 1Hz resolution. Although this is OK, it still does not overcome the fractional frequency components and requires considerable computational effort.
Some designs use a phaselocked loop, that tracks the running frequency and sets the FFT analysis sampling frequency to a multiple (e.g. 20x) of the running speed. Although this is a very good workaround, it requires specialised hardware (such as an expensive ASIC) and is inflexible for changes in running speed.
ML feature extraction, DSP algorithms and models
In order to build an ML (machine learning) model for an AI CbM application, several challenges need to be overcome.
- Definition of classes: In order to make a classification, ML classes must be defined. In the simplest sense, this can be Fault or Normal behaviour, but what about other cases?
- ML Features: what data features will be used for the ML model? Running speed, harmonics, RMS amplitude? What physical and mathematical principles should I use to build these algorithms?
- Obtaining ML training data: How will you obtain suitable datasets for ML training? In many cases this is not easy to obtain, as many foremen will not allow any disruption to their time-critical production lines.
- Preparing datasets: After answering the aforementioned questions, the next challenge will be to capture and prepare the datasets for the ML classification. This is traditionally where a good 90% of a data scientist’s time will be spent. Therefore, it is prudent to invest in high fidelity feature extraction edge algorithms in order to expedite this step. This will also have the advantage of increasing the reproducibility and consistency of the results, which is where many AI based systems perform poorly.
ASN’s IP blocks and applications
ASN’s vibration IP blocks combine the Fourier transform’s time-frequency integration property, data filtering and a specialised high frequency resolution tracking algorithm to implement the ARAHTA (adaptive running speed and harmonics tracking) algorithm. ARAHTA tracks the vibration sensor’s ODR (output data rate) and calculates the motor/pumps running speed using the sensor’s accelerometer sensor data in real-time. ARAHTA’s high resolution and adaptive tracking mechanism results in a typical running speed accuracy of ±1 RPM across the temperature range and sub-mm displacement accuracy using noisy accelerometer data.
ARAHTA’s high accuracy and flexibility ensures that the resulting ML features are high quality and very consistent in the presence of temperature change and load shifts. This has a significant advantage for CbM applications, whereby fingerprinting a spectral profile can be used to assess the degradation of assets of interest. ARAHTA’s high-resolution spectrum forms the basis of providing an AI algorithm with high accuracy feature-rich information, suitable for classification.
Algorithmic performance
A comparison of the FFT vs the ASN ARAHTA IP blocks is shown below. Setting up a test accelerometer signal comprised of an 8.2Hz sinusoid with amplitude 1g and a few harmonic frequencies at various amplitudes, we can objectively compare the methods.
Analysing Figure 1, notice that the plot shows a comparison of the acceleration spectrum (i.e. the FFT of the acceleration data, shown in red) and the displacement spectrum, shown in blue. Analysing the first peak, notice that as the FFT’s resolution is insufficient, as the algorithm has identified the peak at 8.75Hz, rather than at 8.2Hz. This has a consequence for the amplitude estimation, as the acceleration spectrum amplitude is around 0.34g, rather than the expected 1g. As such, the algorithm incorrectly estimates the displacement at 8.2Hz to be 1mm, rather than 3.69mm.
The true value can be seen in Figure 2, where ARAHTA correctly finds the first resonant peak at 8.2Hz and estimates the correct amplitude of 3.69mm.
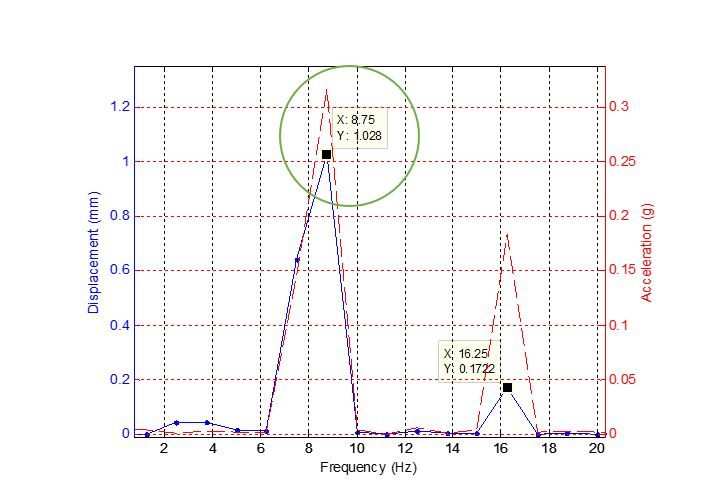
wrong frequency and amplitude estimation
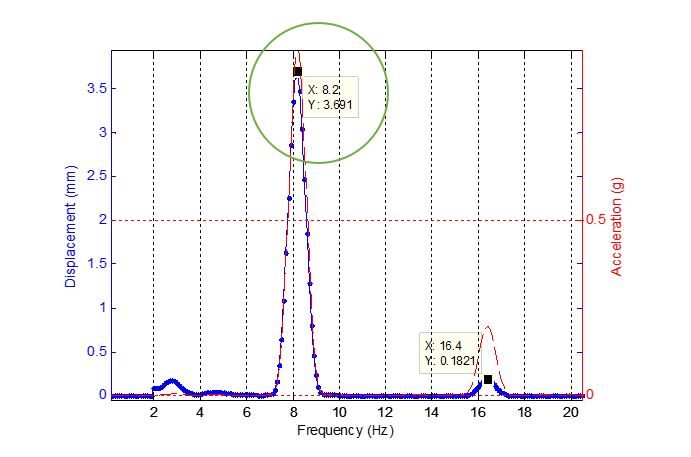
correct amplitude and frequency estimation.
Get in touch and reduce your asset’s TCO
ASN contactless measurement sensor technology and smart algorithms are an ideal solution for AI based CbM applications. Please contact our CbM expert team to see how we can help you create an effective maintenance programme and reduce your asset’s Total Cost of Ownership.


Leave a Reply
Want to join the discussion?Feel free to contribute!