The Covid-19 virus has forced European governments to order millions to lockdown in the hope of limiting the spread of the virus, based on ‘expert scientific advice’. The latest recent review of WHO data by Dutch data modelling specialist, Advanced Solutions Nederland (ASN) reveals that the UK could of adverted strain on services and avoided a sharp rise in Covid-19 cases by taking advantage of being six days behind the infection spread in Northern Europe, but failed to put measures in place in time, due to flawed ‘expert’ predictions.
Central to government policies imposed are predictions being made from statistics that are essentially handling raw data ineffectively. Many models are based on raw measured values that are not adjusted for comparison with neighbouring countries, so called population standardisation, which can give a false perspective of the situation at hand.
– Director of Algorithms and Analytics, ASN, Dr. Sanjeev Sarpal
Ineffective use of modelling to predict virus trend
John Hopkins University (JHU) provide an open database of confirmed cases, deaths and number of recoveries, obtained from data from the World Health Organisation (WHO), various other health intuitions and governments. These datasets are broken down into countries and regions.
Analysis considered data obtained from the following five European countries populations: Germany (83 million), France (67 million) UK (66 million), the Netherlands (17 million), Belgium (11 million).
Our analysts found that by analysing the viral trend by doing a ‘like with like’ comparison of populations rather than the conventional method of non-standardisation, resulted in a totally contradicting set of results, implying that the UK governments response was not informed appropriately.
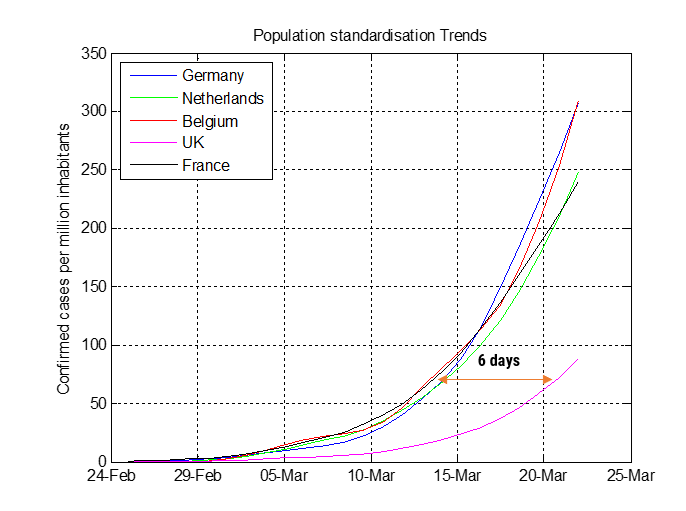
In order to provide an objective comparison per country, the algorithmics results were standardised around the population of each country in order to produce a more accurate deaths per million inhabitants rate. The figure shown below summarises the results.

Analysing the chart, it can be seen that all central countries considered herein all report first cases within days of each other, and have very similar contamination rate. The UK is the exception, as it is approximately 6 days behind mainland Europe.

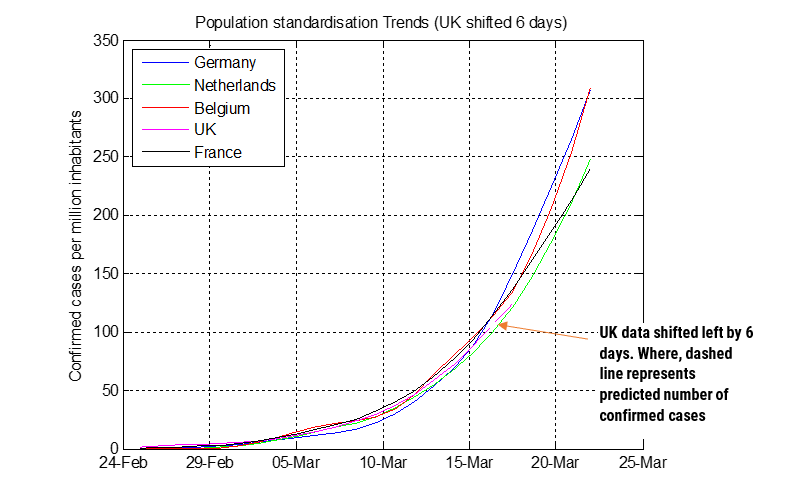
By shifting the UK left by six days, we see that the UK also follows the same trend as its continental neighbours. The dashed line represents the algorithmic prediction of the number of confirmed cases for the next two days (short term prediction), which closely follows the other countries.
Thus, it can be concluded that despite the British government having advanced warning, they failed to adequately prepare themselves for the effects of the virus.
No magic long-term prediction model
There are a multitude of data modelling methods, each giving a different result depending on the interpretation required. For the Covid-19 virus, there is no ‘magic model’ that can be used to predict the long-term severity of the outbreak, as there are too many variables to consider, which are almost impossible to model and track as the pandemic unfolds.
External factors, such as emergency laws, increased public hygiene/diligence and better medical care facilities are but a few major factors that affect any long-term prediction model. These critical factors are generally not modelled when making a prediction model. The short-term prediction shown herein, was just for the next two days, but all prediction models must be viewed with a degree of scepticism, as it is not possible to model all of the unique circumstances that present themselves.
ASN’s data analytics team will be closely monitoring the development of the Covid-19 virus, and providing regular updates via our blog.


Leave a Reply
Want to join the discussion?Feel free to contribute!