Energy companies have struggled for years with meeting demand with supply with society’s increasing demand for energy. This been made even more challenging with more people using electric vehicles and smart cities demanding more lighting.
Modern IoT sensors and smart grid solutions help energy companies and consumers improve and optimize the modern grid for the 21st century. But what does all the jargon really mean?
Blackout
The UK National Grid recently experienced a major outage that left almost a million homes in the dark and forced trains to a standstill. The source of the blackout was traced back to two generators that failed, resulting in grid’s frequency falling below the critical 49.5Hz set by the regulator.
According to the media the UK blackout was triggered when the frequency slumped to 48.88Hz, which is well below the legal limits set by the regulatory agencies.
But what do these limits really mean?
Some background information
The energy grid frequency is 50Hz in Europe, 60Hz in the US. Japan has an unusual historical situation in that the East of the country runs on a European 50Hz system and the West of country runs on an American 60Hz system.
In all cases, in order to meet the energy requirements, several generators are needed to work in parallel and must be synchronised. Accurate frequency control is required to control the amount of power delivered by multiple generators in order to provide a stable power supply to consumers. The challenge for the energy companies is meeting the changes in supply and demand, since higher demand than supply will result in fall of frequency and vice versa.
Thus, the challenge for IoT sensors and algorithms is measuring the operating frequency and phase to a sufficient accuracy and adjusting the generators to meet the energy demand requirement at that particular time. But how?
A PMU (phase measurement unit) is typically used the measure and report back (typically 30-60 measurements per second) to the network operator what the actual frequency and phase of various points on the grid are. In order to synchronise the measurements, the PMU internal clocks are time synchronised via a GPS (global positioning system) unit, such that all reported frequency and phase measured across the grid are time aligned.
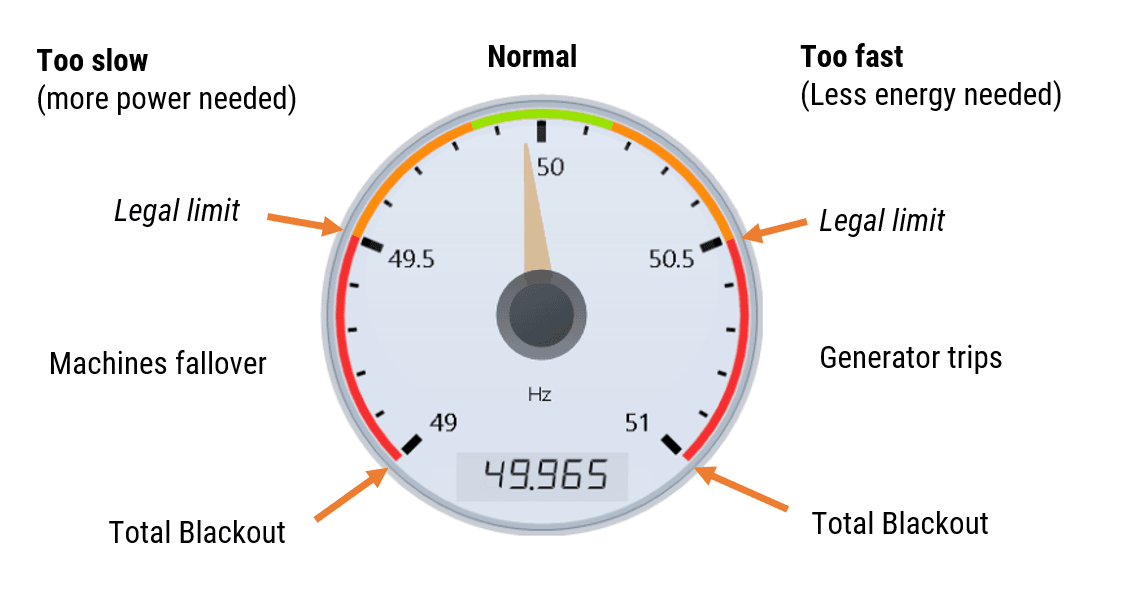
The frequency limits are shown below:
The challenge for energy managers
As seen above, the normal region in Europe is between 49.85 – 50.15Hz. If the generators exceed 50.15Hz (entering the orange region), there is too much energy and the generators need to be rolled back a little. If the frequency falls below 49.85Hz (also in the orange region), there is not enough energy to meet demand, and more energy is needed. In all cases, the frequency must never enter the red region, otherwise Blackouts will occur.
The energy company is legally obliged to keep the powerline frequency between 49.5 – 50.5Hz (± 1%). This is typically tracked to an accuracy of ± 1mHz resolution.
Blackouts
The UK blackout was triggered when the frequency slumped to 48.88Hz, which is well below the legal limits and in the blackout region. The damage to the UK economy has still yet to be determined, but National Grid UK should be considering adding extra redundancy safe guards in order restore public confidence.
Dips and swells tracking
Another common problem that occurs is that of energy dips, i.e. the voltage momentarily drops for a few cycles. Think about lights temporarily flickering in your house.
In factories running machinery, this usually occurs when a machine is started up, indicating imminent component failure. Swells are the opposite of dips, but are much less common.
ASN’s IoT sensor and algorithms play an essential role in keeping the grid healthy, as demonstrated in the video below.


Leave a Reply
Want to join the discussion?Feel free to contribute!