Energy companies have struggled for years with meeting demand with supply with society’s increasing demand for energy. This been made even more challenging with more people using electric vehicles and smart cities demanding more lighting.

Modern IoT sensors and smart grid solutions help energy companies and consumers improve and optimize the modern grid for the 21st century. But what does all the jargon really mean?

Blackout

The UK National Grid recently experienced a major outage that left almost a million homes in the dark and forced trains to a standstill. The source of the blackout was traced back to two generators that failed, resulting in grid’s frequency falling below the critical 49.5Hz set by the regulator.

According to the media the UK blackout was triggered when the frequency slumped to 48.88Hz, which is well below the legal limits set by the regulatory agencies.

But what do these limits really mean?

Some background information

The energy grid frequency is 50Hz in Europe, 60Hz in the US. Japan has an unusual historical situation in that the East of the country runs on a European 50Hz system and the West of country runs on an American 60Hz system.

In all cases, in order to meet the energy requirements, several generators are needed to work in parallel and must be synchronised. Accurate frequency control is required to control the amount of power delivered by multiple generators in order to provide a stable power supply to consumers. The challenge for the energy companies is meeting the changes in supply and demand, since higher demand than supply will result in fall of frequency and vice versa.

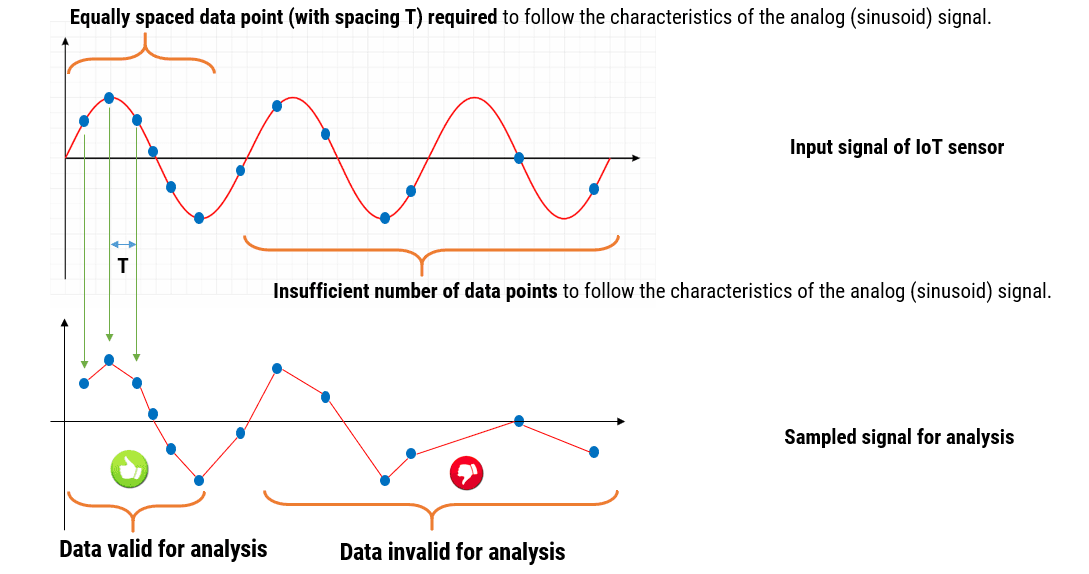
Thus, the challenge for IoT sensors and algorithms is measuring the operating frequency and phase to a sufficient accuracy and adjusting the generators to meet the energy demand requirement at that particular time. But how?

A PMU (phase measurement unit) is typically used the measure and report back (typically 30-60 measurements per second) to the network operator what the actual frequency and phase of various points on the grid are. In order to synchronise the measurements, the PMU internal clocks are time synchronised via a GPS (global positioning system) unit, such that all reported frequency and phase measured across the grid are time aligned.

The frequency limits are shown below:

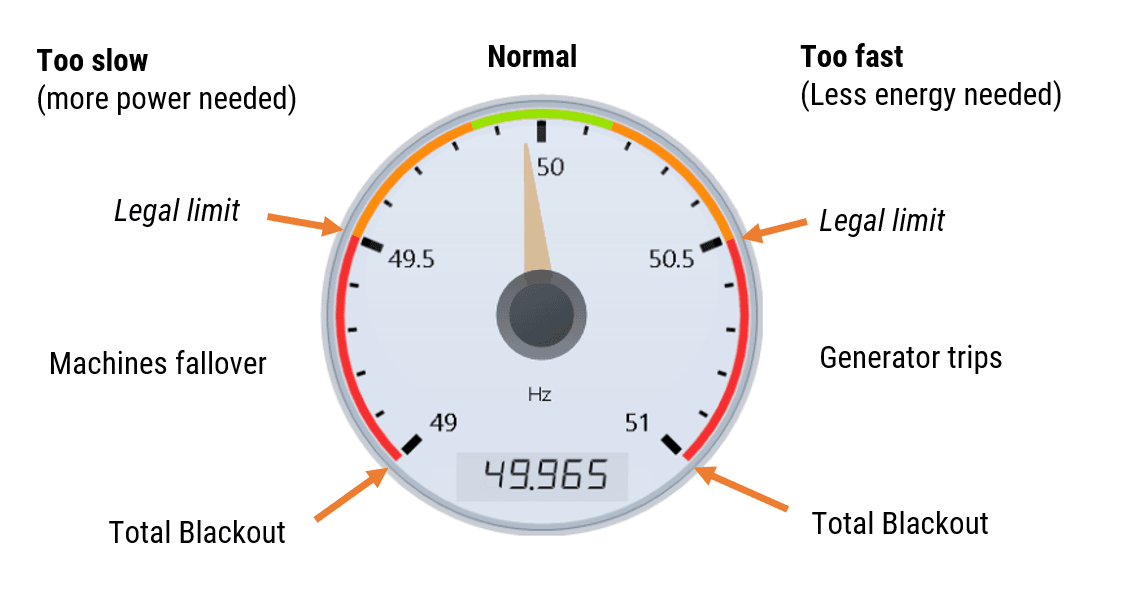
The challenge for energy managers

As seen above, the normal region in Europe is between 49.85 – 50.15Hz. If the generators exceed 50.15Hz (entering the orange region), there is too much energy and the generators need to be rolled back a little. If the frequency falls below 49.85Hz (also in the orange region), there is not enough energy to meet demand, and more energy is needed. In all cases, the frequency must never enter the red region, otherwise Blackouts will occur.

The energy company is legally obliged to keep the powerline frequency between 49.5 – 50.5Hz (± 1%). This is typically tracked to an accuracy of ± 1mHz resolution.

Blackouts

The UK blackout was triggered when the frequency slumped to 48.88Hz, which is well below the legal limits and in the blackout region. The damage to the UK economy has still yet to be determined, but National Grid UK should be considering adding extra redundancy safe guards in order restore public confidence.

Dips and swells tracking

Another common problem that occurs is that of energy dips, i.e. the voltage momentarily drops for a few cycles. Think about lights temporarily flickering in your house.

In factories running machinery, this usually occurs when a machine is started up, indicating imminent component failure. Swells are the opposite of dips, but are much less common.

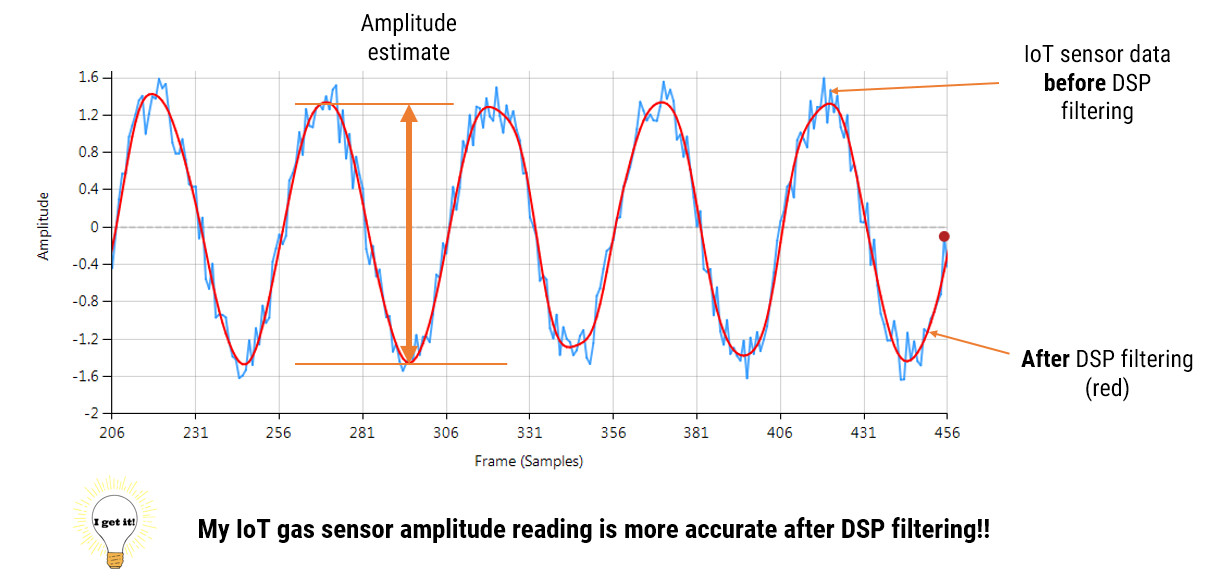
ASN’s IoT sensor and algorithms play an essential role in keeping the grid healthy, as demonstrated in the video below.

5G’s claim of ultra-low latency, and suitability for real-time edge processing has created a fever of interest in the IoT market. But what does Real-time dataset analysis really mean for your IoT application?

It’s estimated that the global smart sensor market will have over 50 billion smart devices in 2020. All of these IoT smart sensors (temperature, pressure, gas, image, motion, loadcells) will be connected to Wifi, 5G, LoRa etc network services via embedded processors performing real-time signal processing on the captured datasets.

But there are a number of challenges….

IoT sensor measurement challenge

A common challenge is that many sensors used in these applications require a little bit of filtering in order to clean the measurement data in order to make it useful for analysis.

Let’s have a look at what sensor data really is…. All sensors produce measurement data. These measurement data contain two types of components:

  • Wanted components, i.e. information what we want to know
  • Unwanted components, measurement noise, 50/60Hz powerline interference, glitches etc – what we don’t want to know

Unwanted components degrade system performance and need to be removed.

So, how do we do it?

DSP means Digital Signal Processing and is a mathematical recipe (algorithm) that can be applied to IoT sensor measurement data in order to clean it and make it useful for analysis.

But that’s not all! DSP algorithms can also help in analysing data, producing more accurate results for decision making with ML (machine learning). They can also improve overall system performance with existing hardware (no need to redesign your hardware – a massive cost saving!), and can reduce the data sent off to the cloud by pre-analysing data and only sending what is necessary.

Do you have a practical example?

All analog sensor signals need to be sampled by a digital system in order to make them usable for analysis in the digital domain.  The choice of the sampling frequency is primarily goverend by the maximum frequency that needs to be analysed. But what are design rules?

Consider the following application for gas sensor measurement (see the figure below). The requirement is to determine the amplitude of the noisy sinusoid (shown in blue) in order to get an estimate of gas concentration, where the bigger amplitude, the more the gas concentration.

In order to clean the noisy sinusoid with a filtering algorithm (results shown in red), we first need to find what the frequency of the sinusoid is. The Nyquist sampling Theorem is used for determining this value, and states that,

the analog signal must be sampled at a least two times the maximum analog frequency component.

For our gas sensor, the frequency of the blue sinusoid is about 5Hz, so a minimum sampling frequency of 10Hz is required in order to perform valid analysis on the sampled dataset. However, many designers choose a value 10 times higher than Nyquist in order account for the effects of the noise component and not to be on the borderline of the Nyquist-sampling theorem.

The concept of sampling is demonstrated below:


What does Real-time really mean?

Many clients ask us to clarify what real-time really means.

Most people assume that an instant response to a button push or event means real-time. However, the reality is a little more complicated, as a real-time system means that the response is deterministic occurring within a known time frame. This could be seconds or even micro-seconds. In all cases, the response or action time is always known.

For the gas sensor discussed above, the sampling frequency must be constant in order to correctly follow the characteristics of the sinusoid. If the sampling rate varied over time, the sampled data wouldn’t match the design criteria of the algorithmic filtering blocks, and the data analysis would be invalid.

In recent years, much has been said about 5G’s potentially ultra-low latency, and suitability for real-time edge processing. Time will tell how far 5G’s low latency claim can be realised. However, latency in network/cloud services, means that no communication channel can be guaranteed to be real-time 100% of the time. This is further complicated by the requirement of meeting the Nyquist-sampling criteria for sampling analog sensors signals.

In light of all of these issues, our experience has shown that real-time sensor processing (especially for critical automotive or industrial control operations) should be performed at the edge on an embedded real-time processor for maximum reliability and safety.

Our close collaboration with leading technology companies, such as: Arm, Texas Instruments and KPN ensure that our 5G IoT solutions are built with the latest design paradigms using the best of today’s sensor and networking technology.