An all-pass equalisation filter cascade (Heq) is available for equalising the phase response of the H1 filter cascade and H2 filter respectively.
Many Audio/acoustics engineers, researchers and audio hobbyists work with DSP (Digital Signal Processing). In this article, you’ll find out how the ASN Filter Designer helps both experienced audio engineers and engineers where DSP is not their daily job to create digital filters for audio and speech.
For whom?
If you are an audio/acoustics engineer, researcher or even a hobbyist with a little bit of DSP knowledge: ASN Filter Designer is for you! The tool offers the following benefits:
- Intuitive and easy to use.
- Logarithmic frequency axis.
- Save days of time spending calculating on your own for the price of 2-3 hours of work.
- Few lesser costs then extensive tooling with features you don’t use anyway.
- Automatic code generation: export for further analysis to Matlab, etc, or to Cortex-M Arm based processors via the Arm CMSIS-DSP software framework.
How DSP for Speech and audio benefit from ASN Filter Designer:
- Experiment with a variety of equalisation, noise cancellation and sound effect audio filtering algorithms.
- Perform data analysis in the frequency domain and via specialised methods, including Cepstral analysis on the streaming data.
- Import your own wav audio files (mono or stereo up to 48kHz) for streaming, and modify the filter characteristics in real-time while listening to the filtered audio stream.
Some features for creating digital filters for Audio and Speech:
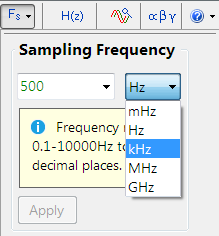
The sampling frequency may be specified up to 4 decimal places
This is useful for designing filters based on fractional sampling frequencies, such as multiples of the 44.1kHz audio standard. Common examples include audio interpolation filters: 44.1kHz × 128 = 5.6448MHz and 44.1kHz × 256 = 11.2896MHz.
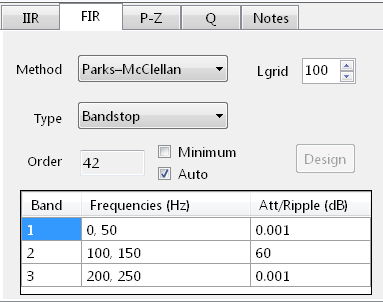
Filter orders of up to 499
Long FIR filters may be constructed, where this is limited to 200 for streaming audio applications.
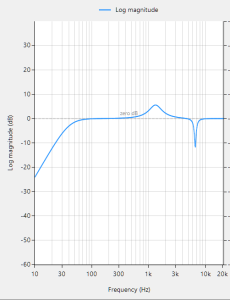
Logarithmic frequency axis
Perform detailed analysis across the complete audio spectrum 20Hz-20kHz.
Audio and user data playback streaming
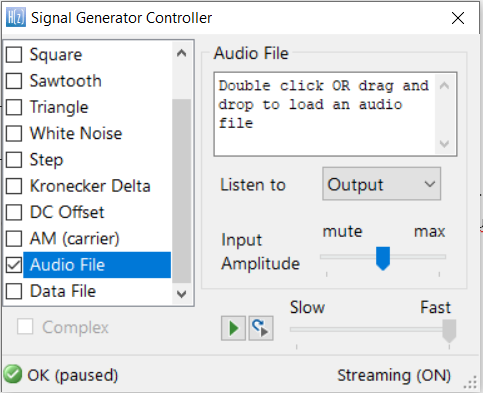
Choose what you want to listen to; Adjust the amplitude of the input signal
The signal analyzer allows designers to test their design on audio, real (user) data or synthetic data via the built-in signal generator. Default data playback is implemented as streaming data, providing a simple way of assessing the filter’s dynamic performance, which is especially useful for fixed point implementations. Both frequency domain and time domain charts are fully supported, allowing for design verification via transfer function estimation using the cross and power spectral density functions. As with all other charts, the signal analyzer chart fully supports advanced zooming and panning, as well as comprehensive chart data file export options.
Load .wav for playback
The signal generator allows you to load .wav audio files for playback via the Audio File method. Both mono and stereo formats are fully supported for 8.000, 11.025, 16.000, 22.05, 44.1 and 48kHz. sampling rates. There is no restriction as to the length of the .wav file.
You may add extra signals to input audio stream
Use the signal generator to add sinewaves and white noise to the data stream.
Intuitive data analysis with the mouse
Move the mouse over the chart will automatically produce data markers and data analytics (shown at the bottom right side of the GUI). The signal analyzer is directly coupled to the filter designer GUI. This means that you may modify the filter characteristics, and see the effects in real-time in the signal analyzer. This functionality is very useful when designing audio filters, as the new filter settings can be heard immediately on the streaming audio feed.
Digital filters commonly used in audio and speech

The ASN Filter Designer includes digital filters commonly used in audio such as:
- All-pass filter for improving phase response
- Bell filter/Peaking filter to perform magnitude equalization
- Linear Phase Filters for prevention of phase
- The APF equalizer for linearising the passband phase
- A-curve equalization, for modelling perceived sound
- Comb filter for powerline (50/60Hz) harmonic noise cancellation
- 3-band equalizer
- And many more…
Read review here:
Top marks from Jacob Beningo

New book on Arm’s latest processors: The Definitive Guide to Arm Cortex-M23 and Cortex-M33 Processors. The book is written by Joseph Yiu, Arm’s resident architecture guru. It features benchmarks and experiments with our DSP filter design tooling (ASN Filter Designer) using CMSIS-DSP for Arm’s latest processors
We’re proud that Dr. Sanjeev Sarpal, Director of AI at Advanced Solutions Nederland has provided support in the digital filter design topic. We’re also very pleased to announce that Joseph Yiu’s new book features a chapter on the ASN Filter Designer for AI/IoT applications using the M23 and M33 Cortex-M cores. Advanced Solutions Nederland works closely with Arm’s DSP/architecture team for AI/DSP solutions using their cores. We’re currently working with Arm on releasing whitepapers on the Cortex-M55.
Armv8-M architecture and its features
The Definitive Guide to Arm® Cortex®-M23 and Cortex-M33 Processors focuses on the Armv8-M architecture and the features that are available in the Cortex-M23 and Cortex- M33 processors.
This book covers a range of topics, including:
- the instruction set
- the programmer’s model
- interrupt handling
- OS support
- debug features
It demonstrates how to create software for the Cortex-M23 and Cortex-M33 processors by way of a range of examples. This enables embedded software developers to understand the Armv8-M architecture.
Worked out examples with ASN Filter Designer
Joseph Yiu’s new book features a chapter on the ASN Filter Designer for AI/IoT applications using the M23 and M33 Cortex-M cores. Our Director of AI, Dr. Sanjeev Sarpal, has provided support.
“The ASN Filter Designer Professional software supports a wide range of filter types. Its design allows filters to be designed via an interactive user interface, where various parameters can be adjusted and the design’s output can immediately be viewed. It also supports the simulation of the filter’s response so that the simulation outputs can be examined to determine whether the filter meets the requirements of the application. An added bonus, for developers creating software for Cortex-M processors, is that it generates C code that directly call CMSIS-DSP library functions (the designed filters can also be exported to C/C++, Python, Matlab, etc.).”
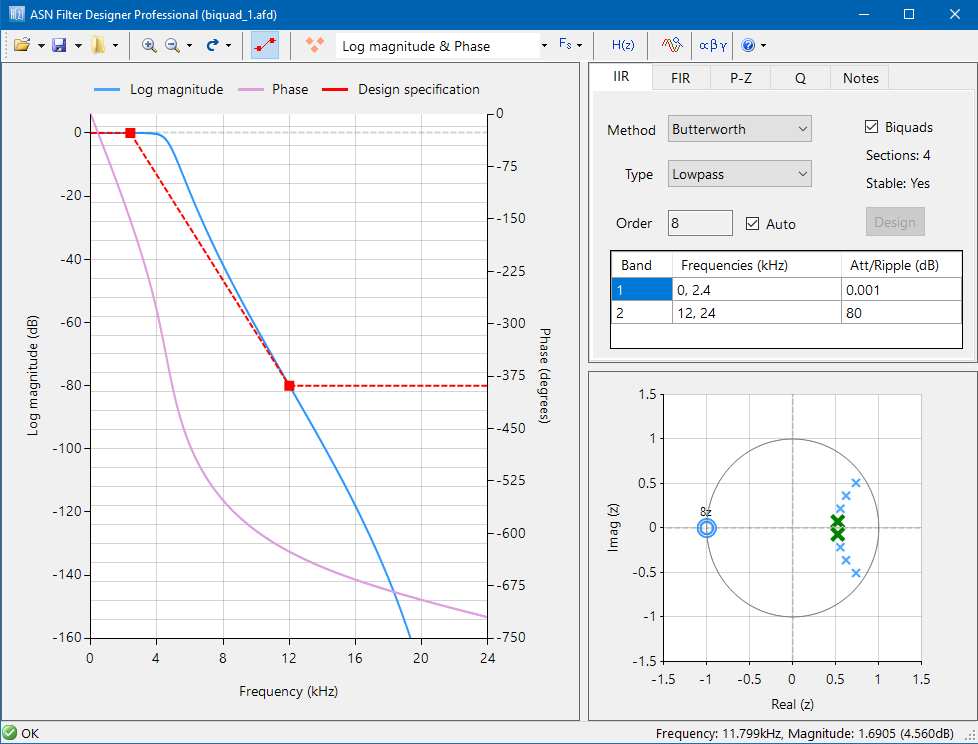
“A number of commercial filter-design software tools are designed specifically for filter-design tasks and make it easier tot analyze a filters’ characteristics. For software developers who are not familiar with filter designs, these tools can be a great help” (p. 820). Thereby, Joseph Yiu uses the ASN Filter Designer for worked out examples. He creates a low pass biquad filter for a system with 48kHz sampling rate and with single-precision floating-point data type.

Order your copy here
For many, Covid-19 was an eye-opener for the importance of indoor air quality. One of the most important pollutants indoors is Carbon Dioxide (CO2). Children spend a large portion of the day at school. Research shows that there are high levels of CO2 in many classrooms. Those high CO2 levels affect the sense of wellbeing, and even worse: school grades.
CO2 levels in school too high
The Western Cooling Efficiency Center (UC Davis ) shows: “Research from around the world shows there are high CO2 levels in many classrooms. For example, in a 2019 study, researchers found that about 85% of 94 recently installed HVAC systems in California K-12 classrooms did not provide adequate ventilation.”They investigated 104 classrooms in California. 85% did not have proper ventilation, which means increased levels of CO2.
In indoor testing between 2010 and 2015, 43% of Toronto schools had a CO2 concentration above 1000 ppm.
Why does the last hour always take ages?

After sitting the whole day at school, the last hour seems to take ages. Always getting a headache. You can’t concentrate and think properly. Probably the cause it isn’t the teacher. It’s you, the students.
Students and the teacher breathe oxygen into the lungs as energy. The oxygen sticks to red blood cells and is transported to organs and muscles, so your heart can pump, you can think with your brain and contract your muscles. This ‘burning’ process of oxygen turns into carbon dioxide (CO2) and water vapor, which are released back into the environment.
When the ventilation is poor, the ‘used’ air will not dilute enough with ‘new’, fresh air from outside. So, especially with many people in a closed room (like a class-room) and the ventilation is poor, the oxygen in this room gets more and more replaced by CO2.
CO2 itself is not toxic. In fact, it’s a natural part of the atmosphere. It’s the fact that it’s replacing the oxygen concentration because a high concentration of CO2 is toxic. (That’s why CO2 is called an ‘asphyxiant gas’: a nontoxic or minimally toxic gas which reduces or displaces the normal oxygen concentration in breathable air.)
How CO2 levels affect school results
Due to the fact that the student inhales less oxygen, less oxygen goes to the brains. If there’s too much CO2, students may find it hard to pay attention to the teacher. Or concentrate on tests. Or stay awake at all. Besides, high levels of CO2 may affect the ability to make decisions. So, without even realizing yourself, high CO2 can damage your productivity and your school results. Besides, when we think of gasses, we think smell will warn us. However, CO2 is odourless.
CO2 might also cause physically complaints:
- Headache
- Feeling dizzy or nauseous
- Tired
- Trouble breathing
- Worsen asthma symptoms, allergies and lung health
You yourself might feel complaints, while the student next to you doesn’t feel anything. How you react, depends on several factors – such as: your own health, heredity, personal habits as smoking and drinking, use of medicine, previous exposure to chemicals.
What are high CO2 Levels?
As said, CO2 is a gas that is a natural part of the air. CO2 is measured in so-called parts per million (ppm). Outside, the normal level is about 400ppm. Otherwise said: per 1 million parts in the air, 400 of them consists of carbon dioxide. Before the industrial revolution, this level was about 280 ppm.
In general, occupied rooms with good ventilation have 400 – 1,000ppm. However, from 800 ppm, people may begin to suffer, maybe without knowing themselves.
From 1,000 to 2,000 ppm, people get complaints of drowsiness and poor air. When the level is between 2,000 to 5,000 ppm: complaints of headaches and sleepiness. The air becomes stale, stagnant and stuffy. As a consequence, people have lower concentration and loss of attention. An increased heart rate and slight nausea may also be the case.
From more than 5,000 ppm, the air becomes toxic and more serious effects can occur.
Common HVAC Issues resulting in high CO2 levels
In modern times, schools and other buildings are built with comfort in mind: to create a comfortable, warm space, thanks to isolation and… However, this comfort may come with a downside. Because a room is too closed from the outside world, this may result in the lack of replacing the air inside with fresh air from outside.
In the California study, 85% of the classrooms did not provide adequate ventilation. ‘“We were shocked,” said Wanyu Rengie Chan, one of the lead researchers of the study, “We were not expecting it.”’ They were shocked, because it involved classrooms with newly installed HVAC.
What are HVAC issues, causing high CO2 levels?
- Problems with installation of HVAC systems
- Incorrect HVAC systems purchased
- Incorrect controls and thermostats
- No follow-up testing after installation
- Poorly-maintained filters
(Source: Ventilation Rates in California Classrooms study)
CO2 monitoring helps
Children spend many hours indoors at school. Therefore, it is important to have a good indoor air quality. For the feeling of well-being for the children and teacher, but also for the children’s grades. You can measure the CO2 with a CO2 meter, or a sensor which combines the monitoring of CO2 with temperature, humidity and Volatile Organic Compounds, for instance ASN’s Covid-AIRMEX.
Advanced Solutions Nederland’s AIRMEX employs the Nordic Thingy:52 to provide easy-to-use environmental sensors and wireless connectivity for pandemic management
Nordic Semiconductor today announces that Amersfoort, Netherlands-based, Advanced Solutions Nederland (ASN), an IoT and Industrial IoT (IIoT) sensor technology company, has selected the Nordic Thingy:52 Bluetooth® 5.2/Bluetooth Low Energy (Bluetooth LE) compact multisensor prototyping platform to provide the wireless connectivity and processing power for its ‘AIRMEX’ indoor environmental monitoring solution. AIRMEX is an AI-powered temperature, humidity, CO2, and TVOC (Total Volatile Organic Compounds) sensor platform that enables, for example, workplaces, schools, restaurants, and places of worship to monitor and regulate indoor environmental conditions to minimize the risk of the airborne spread of SARS-CoV-2, the virus that causes Covid-19, as well as promote overall healthy living and working conditions for occupants.
This article is retrieved from Nordic Semiconductor: original publication, 04Mar 2021 Oslo, Norway)
Recommendations for air-quality improvement
The ceiling- or wall-mounted device employs the Nordic Thingy:52’s integrated humidity, temperature and gas sensors to provide continuous, near real time monitoring of environmental air quality. Running ASN’s ‘Chameleon’ AI algorithmic application software—developed and ‘trained’ to promote indoor air conditions that specifically minimize the risk of the spread of Covid-19—the Nordic Thingy:52’s powerful 64MHz, 32-bit Arm® Cortex® M4F processor with floating point unit (FPU), allows the solution to process the data from all four sensor. The applications software does more than simply measure and display temperature and humidity readings, rather it provides real-time updates and recommendations for air quality improvement.
The Nordic Thingy:52 integrates many useful sensors which along with its Bluetooth LE connectivity provides a cost-sensitive solution
Dr Sanjeev Sarpal, ASN
The data is relayed to a Bluetooth 4.0 (and later) smartphone, where from the partner ‘Covid-AIRMEX’ Android app, the user is provided with immediate feedback on overall air quality and recommendations on how to improve the environmental conditions. For example, “increase dehumidifier settings” to reduce humidity, or “very high gas levels present” to indicate inadequate ventilation. In the absence of a smartphone, AIRMEX has a multi-coloured LED indicator to provide users with an immediate overview of current environmental conditions.
AIRMEX uses a standard 1400mAh Li-ion battery to provide approximately six weeks battery life in standard operation, thanks in part to the ultra-low power characteristics of Nordic’s nRF52832 System-on-Chip (SoC) at the heart of the Nordic Thingy:52. The nRF52832 has been engineered to minimize power consumption with a fully-automatic power management system that reduces power consumption by up to 80 percent compared with the nRF51 Series.
Multisensor prototyping platform
The Nordic Thingy:52 is a compact multisensor prototyping platform designed to help wireless IoT sensor projects get off the ground quickly. The product is a fully tested and working wireless sensor platform that can be used by a developer with no high-level development tools or firmware coding expertise to rapidly design wireless IoT devices and associated mobile device and Internet apps. The Nordic Thingy:52 is based on the nRF52832 SoC. The SoC features a 32-bit, 64MHz Arm® Cortex™ M4 processor with a 2.4GHz multiprotocol radio (supporting Bluetooth 5.2, ANT™, and proprietary 2.4GHz RF protocol software) featuring -96dB RX sensitivity, and 512kB Flash memory and 64kB RAM. The SoC runs Nordic’s S132 SoftDevice—a Bluetooth 5-certifed RF software protocol stack for building advanced Bluetooth LE applications—it can support up to 20 concurrent connections in a variety of Bluetooth LE role combinations.
“The Nordic Thingy:52 integrates many useful sensors which along with its Bluetooth LE connectivity provides a cost-sensitive solution,” says Dr Sanjeev Sarpal, Director AI Data Algorithms & Analytics at ASN. “The well written firmware libraries also helped our developers get up and running in a fraction of the time rather than starting a development from scratch, while the reference designs and good documentation were equally an important consideration in selecting the solution.”
Since Covid-19, there is even more attention for indoor air quality. It might be possible that poor ventilation may contribute to the spread of the coronavirus. In any case, some contaminations are already known to decrease indoor air quality. Poor Humidity, Temperature, CO2 and TVOC conditions may be the cause. It influences productivity, leads to less sense of comfortability and well-being and can cause sickness. Beat poor indoor Air Quality with data science.
Indoor concentration of pollution often 2 to 5 times higher than outdoor
Did you ever wonder where you are most exposed to air pollution? Somewhere outside, you say? Wrong, you breath the most polluted air… indoors! Research shows, that people spend 90% of their time indoors. Isolation and modern heating have brought us comfy, warm indoor environments: home, work, recreation, etc., with no cold air coming from under the doors or through windows. However, in many buildings there is a downside. With the tightly enclosed indoor environments, pollution caused indoors or coming from outside has no opportunity to mingle with fresh air. For viruses, heat and certain levels of humidity are perfect environments to stay active.
Pollution may lead to:
- Irritation of the throat, nose and eyes, such as a dry throat
- Headaches, dizziness, and fatigue
- Respiratory diseases, heart disease, and cancer
Covid-19
Besides, the Covid-19 virus is spreading. Since Covid-19, there is a lot of attention for indoor door quality. Besides social distancing, wearing a mask and washing your hands, good ventilation is one of the measures to reduce the risk of infection indoors.
CO2 and TVOC measurement for well-being and productivity
Indoor air quality is depending on… inside and outside factors… Besides temperature and humidity, 2 other factors for indoor air quality are CO2 (Carbon Dioxide) and TVOC (Total Volatile Organic Compounds).
CO2 originates when people breathe, sweat and in all other occasions where there is a burning process involved. CO2 concentration has to remains less than 800 PPM. At higher concentrations people begin to suffer.
Besides, many substances are also source of contamination like cleaning products, paints, varnishes, furniture and glues. These are called Volatile Organic Compounds (VOC’s). Immediate complaints may be symptoms headaches, eye, nose and throat irritation and bad odors. Long term exposure may lead in large doses can damage liver, nervous systems and kidneys.
The impaction of the combination of CO2 and TVOC is even larger. A study shows: “On average, cognitive scores were 61% higher on the Green building day and 101% higher on the two Green+ building days than on the Conventional building day.”
Data Science helps you to maintain healthy and productive air quality
Temperature and Ventilation are more important than ever. Regulate your temperature to obtain a comfortable and healthy environment. Replace bad air with fresh air from outside. By ventilation or just by opening a window.
When you’re busy, keeping an eye on working conditions may be easily ignored. Sensors which measure temperature and humidity like the Airmex help you to maintain your indoor air quality such, that the risk of spreading the viruses is as least as possible They also help you to keep a comfortable, healthy and productive environment. It warns you on an app when you should adjust your room temperature or when you should ventilate. Those signals are based on data science and based on guidelines as the ASHRAE Standard 55 – Thermal Environmental conditions for Human Occupancy.
Find out how the Airmex can help you.
You have probably experienced a ‘sick building’ yourself. You may not feel well in a room or building, such as irritated eyes or nose. Without knowing exactly where this feeling comes from. Or you experience that you suddenly feel better when you leave that room or building. The term “sick building syndrome” (SBS) is first used in the 1970s. It describes a situation in which reported symptoms among a population of building occupants can be temporally associated with their presence in that building. Typically, though not always, the structure is an office building.
Symptoms of Sick Building Syndrom (SBS)
In short: more co-workers experience the same complaints when they are in the building or in the same parts of a building. Most of the times, complaints disappear or lessen when people leave those buildings or parts.
Symptoms of a Sick Building Syndrom can include:
- eye, nose and throat irritation (irritation of mucous membranes)
- lethargy or fatigue
- headache, dizziness, nausea
- inability to concentrate
- sensitivity to odors
- general malaise-complaints
Indication that the complaints are caused by Sick Building Syndrome are:
- Are problems temporally related to time spent in a particular building or part of a building?
- Do symptoms resolve when the individual is not in the building?
- Do symptoms recur seasonally (heating, cooling)?
- Have co-workers, peers noted similar complaints?
Difference between Sick Building Syndrome and ‘building related illness’
It is important to distinguish the ‘Sick Building Syndrome’ from building related illness. Building related illness means that symptoms of illness can be directly related to specific airborne building contaminants. Examples are Legionnaire’s Disease or hypersensitivity pneumonitis.
What causes sick building syndrome?
The EPA distinguishes 4 causes of or contributing factors for sick building syndrome (Indoor Air Facts No. 4 (revised) Sick Building Syndrome):
- Inadequate ventilation
- Chemical contaminants from indoor sources
- Chemical contaminants from outdoor sources
- Biological contaminants
Inadequate ventilation
Due to the fact that outdoor air ventilation is inadequate to maintain the health and comfort of the people inside the people. Another reason for inadequate ventilation may occur if heating, ventilation and air condition (HVAC) systems do not effectively distribute air to people inside the building
Chemical contaminants from indoor sources
Most of the indoor pollution comes from sources inside the building. For example: adhesives, carpeting, upholstery, manufactured wood product, copy machines, pesticides and cleaning products may emit volatile organic compounds (VOCs), including formaldehyde. Tobacco smoke may also be a source, if smoking is still allowed inside the building. Another source may be combustion products, due to unvented gas and kerosene heaters, gas stoves, woodstoves and fireplace
Chemical contaminants from outdoor sources
For example, motor vehicle exhausts which enters the building
Biological contaminants
Examples are bacteria, molds, pollen, viruses and animal droppings
It’s possible that the underlying causes of the above-mentioned factors are:
- Poor ventilation, due to poor design, maintenance or operation. The ventilation itself can be a source of irritants. Besides, interior redesign such as rearrangement of offices may cause inefficient functioning of the systems.
- These elements may act in combination. Where some pollutants themselves are at a very low level, the way they react on each other may cause health effects
- Elements may supplement other complaints such as inadequate temperature, humidity, or lighting. High humidity may contribute to biological pollutant problems. On the other side, levels below 20 or 30 percent may heighten the effects of mucosal irritants and may be irritating itself
- Other factors may also play a role, such as stress, noise, insufficient light.
Solutions like the Airmex can help you to create a safe and healthy environment for work, meeting and living. It monitors your air quality and alarms you when the air quality has dropped below acceptable levels