The Covid-19 virus has forced European governments to order millions to lockdown in the hope of limiting the spread of the virus, based on ‘expert scientific advice’.  The latest recent review of WHO data by Dutch data modelling specialist, Advanced Solutions Nederland (ASN) reveals that the UK could of adverted strain on services and avoided a sharp rise in Covid-19 cases by taking advantage of being six days behind the infection spread in Northern  Europe, but failed to put measures in place in time, due to flawed ‘expert’ predictions.

Central to government policies imposed are predictions being made from statistics that are essentially handling raw data ineffectively. Many models are based on raw measured values that are not adjusted for comparison with neighbouring countries, so called population standardisation, which can give a false perspective of the situation at hand.

– Director of Algorithms and Analytics, ASN, Dr. Sanjeev Sarpal

Ineffective use of modelling to predict virus trend

John Hopkins University (JHU) provide an open database of confirmed cases, deaths and number of recoveries, obtained from data from the World Health Organisation (WHO), various other health intuitions and governments. These datasets are broken down into countries and regions.

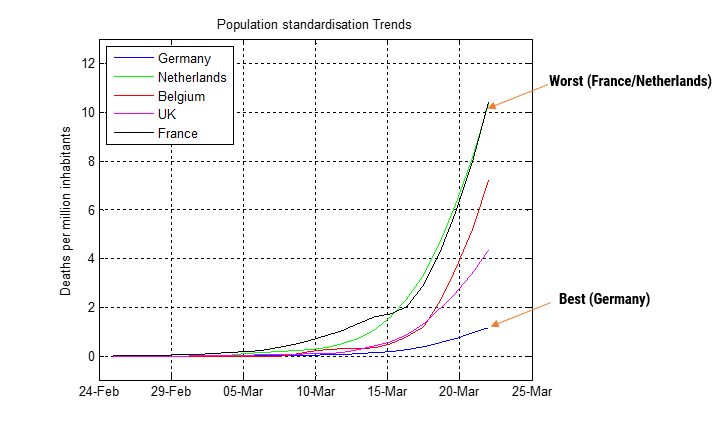
Analysis considered data obtained from the following five European countries populations: Germany (83 million), France (67 million) UK (66 million), the Netherlands (17 million), Belgium (11 million).

Our analysts found that by analysing the viral trend by doing a ‘like with like’ comparison of populations rather than the conventional method of non-standardisation, resulted in a totally contradicting set of results, implying that the UK governments response was not informed appropriately.

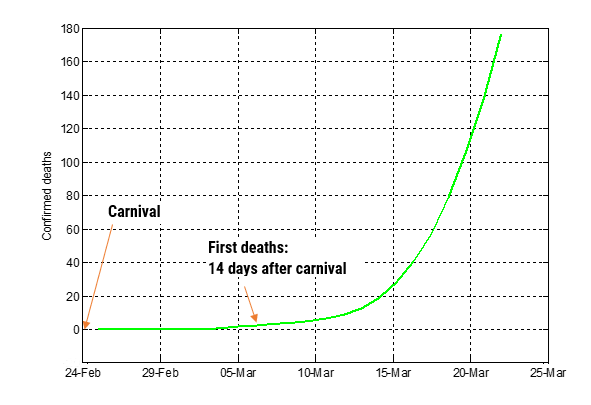
In order to provide an objective comparison per country, the algorithmics results were standardised around the population of each country in order to produce a more accurate deaths per million inhabitants rate. The figure shown below summarises the results.

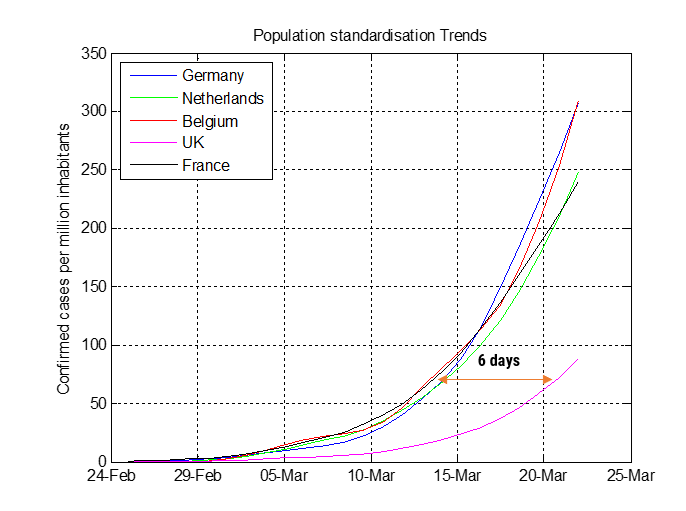
Analysing the chart, it can be seen that all central countries considered herein all report first cases within days of each other, and have very similar contamination rate. The UK is the exception, as it is approximately 6 days behind mainland Europe.

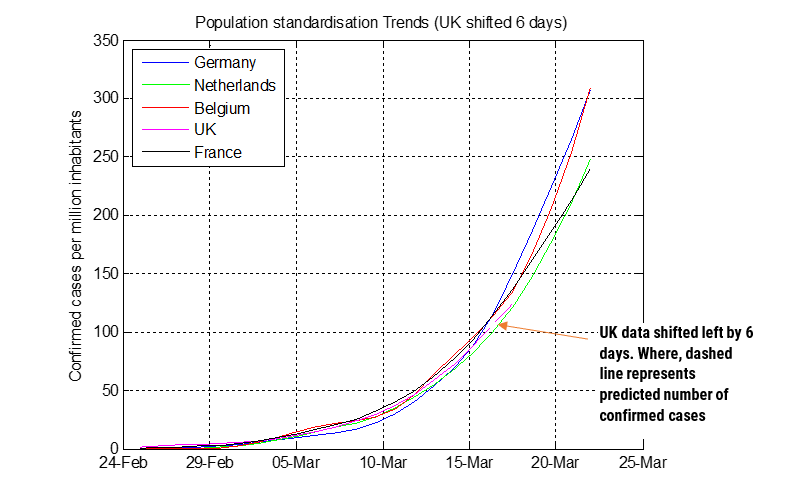
By shifting the UK left by six days, we see that the UK also follows the same trend as its continental neighbours. The dashed line represents the algorithmic prediction of the number of confirmed cases for the next two days (short term prediction), which closely follows the other countries.

Thus, it can be concluded that despite the British government having advanced warning, they failed to adequately prepare themselves for the effects of the virus.

No magic long-term prediction model

There are a multitude of data modelling methods, each giving a different result depending on the interpretation required. For the Covid-19 virus, there is no ‘magic model’ that can be used to predict the long-term severity of the outbreak, as there are too many variables to consider, which are almost impossible to model and track as the pandemic unfolds.

External factors, such as emergency laws, increased public hygiene/diligence and better medical care facilities are but a few major factors that affect any long-term prediction model. These critical factors are generally not modelled when making a prediction model. The short-term prediction shown herein, was just for the next two days, but all prediction models must be viewed with a degree of scepticism, as it is not possible to model all of the unique circumstances that present themselves.  

ASN’s data analytics team will be closely monitoring the development of the Covid-19 virus, and providing regular updates via our blog.

The Netherlands is regarded by the International Monetary Fund (IMF) as one the richest countries in the world, with high life expectancy, good infrastructure and a liberal society.  The Dutch have historically been traders, learning multiple foreign languages and trading with the whole world – a practice that is still continued to this date. The Dutch love to travel, which may have been one of main factors for the Covid-19 virus gripping the Netherlands so severely.

The Covid-19 virus has led all European governments to effectively lockdown their countries in the hope of limiting the spread of the virus. Although some see this as a violation of their civil rights, the Dutch government’s ambition is to limit the spread of virus so that the health system can cope with a controlled flow of infections.

Population standardisation and carnival

New research from the University of Massachusetts, suggests that the median incubation period (i.e. the time between exposure to the virus and the appearance of the first symptoms) for Covid-19 is just over five days and that 97.5% of people who develop symptoms will do so within 11.5 days of infection.

John Hopkins University (JHU) provide an open database of confirmed cases, deaths and number of recoveries, obtained from data from the World health organisation (WHO), and various other health intuitions and governments. These datasets are broken down into countries and regions.

Applying our ANNA data modelling algorithms to the raw datasets provided by John Hopkins University (JHU), we were able to plot the mortality rate versus time for the Netherlands, as shown below.

Confirmed deaths for the Netherlands: source JHU database

Many models are based on raw measured values that are not adjusted for comparison with neighbouring countries, so called population standardisation, which can give a false perspective of the situation at hand.

The yearly Carnival festivals that takes place around the 23-Feb, attracts large crowds of people (shown on the right). This incubation period of approximately 12 days can be clearly seen in the data for the Netherlands, where the first deaths are reported around 7-March (14 days after carnival), suggesting that if not adequately treated in hospital, the patient will die within a few days.

Our analysis considered data obtained from the following five European countries (populations shown in parenthesis): Germany (83 million), the Netherlands (17 million), Belgium (11 million), UK (66 million) and France (67 million).

In order to provide an objective comparison per country, the algorithmic results were standardised around the population of each country in order to produce a deaths per million inhabitants rate. The figure shown below summarises the results.

Population standardisation trends: deaths per million inhabitants

Analysing the chart, it can be seen that when viewing the scaled dataset, the Netherlands (green) and France (black) have the highest mortality (death) rate, and Germany (blue) the lowest. France’s high mortality rate may be attributed to many foreigners visiting France for their winter holiday.

A disastrous combination of events

Analysing the various news reports, the Brabant province in the South of the Netherlands was a particular hotspot for the virus. Our findings as to the likely reasons why the contagion rate in Brabant is so high can be attributed to a combination of the following factors:

  • The yearly Carnival festivals taking place around the 23 February, which attract large crowds of people.
  • Frequent foreign travel of people working for large international business, such as Philips and ASML.
  • School holiday.
  • People taking their winter holidays in France and Italy.

Had carnival taken place several weeks earlier, the effects on the Dutch population may have very well been lower.

Another hotspot for the virus was Amsterdam, which like Brabant is a hub for international business, and a very densely populated region of the country.

Conclusions

The Covid-19 incubation period for the Netherlands is around 12 days.   

When standardising the mortality rate population data per million inhabitants with surrounding countries, the Netherlands and France have the highest mortality rate of all of their neighbouring countries. A likely explanation of the explosive outbreak in the Brabant province of the Netherlands, is due to Carnival festival, the school/winter holiday and international business travel. France’s high mortality rate may be attributed to many foreigners visiting France for their winter holiday.

Despite Germany’s large population of 83 million, the data shows that the German government’s handling of the situation has been very effective indeed. The German health system boasts over 25,000 intensive care beds, and respiration equipment. Comparing this this Netherlands, which just has a little over 1,150 beds, and adjusting for the population differences – Germany still has more than 4.5 times more intensive care beds at its desposal.

In terms of prevention: Germany’s National Association of Statutory Health Insurance Physicians, reports that it has capacity for approximately 12,000 Covid-19 tests per day, which surpasses all other European countries.

Advanced Solutions Nederland is happy to announce that the ASNFD filtering Arm MDK5 software pack now avalailable for download! The filtering pack provides MDK users with an easy way of ASN’s IP.

Keil MDK is the most comprehensive software development solution for Arm-based microcontrollers. For MDK, additional software components and support for microcontroller devices is provided by software packs. Download here

UI experience 2020 pack

After downloading the ASN Filter Designer, most people just want to play with the tool, in order to get a feeling of whether it works for them. But how do you get started with the ASN Filter Designer? Based on some great user feedback, ASNFD v4.4 now comes with the UI experience 2020 pack. This pack includes detailed coaching tips, an enhanced user experience and step-by-step instructions to get you started with your design.

A quick overview of the ASN Filter Designer v4.4 is given below, and we’re sure that you’ll agree that it’s an awesome tool for DSP IIR/FIR digital filter design!

The ASN Filter Designer has a fast, intuitive user interface. Interactively design, validate and deploy your digital filter within minutes rather than hours. However, getting started with DSP Filter Design can be difficult, especially when you don’t have deep knowledge of digital signal processing. Most people just want to experiment with a tool to get a feeling whether it works for them (sure, there are tutorials and videos). But where do you start?

Start experimenting with filter design immediately

That’s why we have developed the UI Experience 2020 pack. Based on user feedback, we’ve created detailed tooltips and animations of key functionality. Within minutes, you’ll get a kick-start into functionalities such as chart zooming, panning and design markers.

Coaching tips, enhanced user experience, step-by-step instructions

Based on user feedback, the UI Experience 2020 pack includes:

  • Extensive coaching tips
  • Detailed explanations of design methods and types of filters
  • Enhanced user experience:
    • cursors
    • animations
    • visual effects
  • Short cuts to detailed worked solutions, tutorials and step-by-step instructions

Feedback from the user community has been very positive indeed! By providing detailed tooltips and animations of key functionality, the initial hurdle of designing a filter with your desired specifications has now been significantly simplified.

So start with the ASN Filter Designer right away, and cut your development costs by up to 75%!

ASN Filter Designer box
ASN Filter Designer box, the powerful DSP Filter Designer platform