The Dutch Newspaper De Gelderlander (June 16) headlines: “Where is the virus, am I safe, am I at risk?” The newspapers write this article in response to the major demonstrations in Amsterdam and Rotterdam two weeks ago. The social distancing measures were not adhered to, as if Covid-19 did not exist. They continue: “Half the country shuddered at the sight of a full Dam. Two weeks later, the coast seems clear. Where are we at risk? Time for a mid-term review. “
The newspaper concludes that there are relatively more infections in South Holland.
Then: “Can we have big events again?” The 2 large demonstrations did not cause a major virus outbreak. That is why many hope that large events can be organized again. “Don’t do it, experts warn … The virus is not yet gone, so such events are big risk moments. The more often you organize those, the more likely it will lead to infections”
Risk situations: frequent mutual contact
Based on various outbreaks, there appears to be 1 major risk situation: places where there is a lot of mutual contact. In addition, the newspaper mentions the outbreak in 2 mosques. Besides, they mention the outbreaks in meat processing and fruit growing. “It is clear that sectors with many migrant workers, who often live close together, are hit harder.” In addition to employees, people who regularly visit these companies were professionals who tested positive, such as drivers.
Finally, the newspaper concludes with the WHO’s warning that places where fruit and meat is traded have risks of major outbreaks. After no new Covid cases were found in China for 2 months, there is currently another outbreak in Beijing.
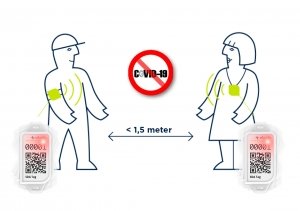
1.5 meters: Social Distancing remains important
Many companies such as offices and factories are currently investigating how they can safely reopen their company for their staff and visitors. Events, cultural institutions and the catering industry also want to offer the safest possible environment. It remains important to keep 1.5 meters away. If you want to learn more how a social distance badge, the covid buzzer can help, visit Covid Buzzer
https://www.advsolned.com/wp-content/uploads/2020/06/social-distancing-covid19-covid-buzzer.jpg5801250ASN consultancy teamhttps://www.advsolned.com/wp-content/uploads/2021/07/asn_logo_red_met_tekst_helder-e1755353934770.pngASN consultancy team2020-06-17 16:02:482020-09-29 10:52:12Frequent mutual contact most important risk situation for Covid-19
As of 1 June, many museums in the Netherlands have reopened to a limited extent: a maximum of 30 people can enter at the same time and they must be kept at least 1.5 meters apart. From July 1, this capacity will be increased to 100 people, if there are no problems. Under which conditions this will happen is not known. In any case, museums and events will have to ensure that the 1.5 meters is maintained.
Many museums are taking measures to provide visitors and employees with a safe environment. Find out how the Covid Buzzer can help.
Maximum capacity and time slots
The most obvious measure is to limit visitor numbers at the gate: visitors sign up for a time slot. A museum usually calculates the capacity per time slot on the basis of the available space. In any case, until 1 July, 10m2 must be available per visitor. The average duration of a museum visit is then also important: on the basis of its capacity and the average duration, the museum has an indication of the number of time slots required and the mutual overlap of these time slots.
Irregular spread
However, visitors will not be regularly scattered around the building. It is likely to be busy at some parts of the building: at entrances, wardrobes, toilets, museum shops, etc. And the same applies to the absolute top pieces: the pieces that all visitors want to see and want to view for quite some time. Museums have created walking routes and have made capacity planning that takes into account crowds at the ‘hot spots’ and where an extra security guard must be placed.
Self-regulating power and more capacity with the Covid Buzzer
Offering “experience” is an important condition for a successful museum visit. Visitors also want to feel welcome in Covid time. Many visitors will understand that for safety reasons they may be led through 1.5 rows along the top piece with a distance of 1.5 meters. For the rest, they will prefer to design their visit as much as possible themselves.
When visitors are enjoying themselves, they may forget to keep a distance. In addition, there will unfortunately always be visitors who do not want to take other visitors into account at all.
The Covid Buzzer helps visitors keep 1.5 meters social distance. By having every visitor wear a Covid Buzzer, these problems are solved. This goes off when visitors come within a radius of 1.5 meters. The Covid Buzzer can also offer a solution for the masterpieces, by letting visitors ensure that they keep a distance of 1.5 meters. And employees can address those who do not obey the rules several times.
Covid Buzzer: Simple, reliable and no privacy issues
The simple solution to keep a safe distance between each other. Everyone in the office, factory or elsewhere where many people gather, wears a buzzer. As soon as the buzzer meets another buzzer within a radius of 1.5 meters, a warning signal follows. The buzzer is completely anonymous, so there are no privacy issues involved. Thanks to UWB technology, the Covid buzzer has 10 cm accuracy.
Government rules after July 1; proof for 1.5 meters
As mentioned, the regulations are still unclear after 1 July. Much will depend on the extent to which museums and other visitors attracting institutions appear to be able to comply with the 1.5-meter provisions.
With the Covid Buzzer, museums show that they are actually able to adhere to the 1.5-meter stipulation.
https://www.advsolned.com/wp-content/uploads/2020/06/woman-covid-19-museum-covid-buzzer.jpg5801250ASN consultancy teamhttps://www.advsolned.com/wp-content/uploads/2021/07/asn_logo_red_met_tekst_helder-e1755353934770.pngASN consultancy team2020-06-09 15:50:392020-09-29 10:54:40How to maintain the social distance in a Museum with the Covid Buzzer
Many offices have been closed or working on less power due to Covid-19. Now many offices want to open again. Last months, most employers have worked at home. There are employers who want to stay working at home, but most miss the energy of working at the office and the efficiency of a direct contact. And the latest gossip is juicier, the bad jokes funnier with an in-real-life cup of coffee together. How to re-open your office safely? Find out how the Covid Buzzer, a social distance badge, helps!
Creating a safe desk
But first, let’s take a look which measures offices take for re-opening. Most of their solutions consist of creating a safe desk. The policy that employees no longer have their own workplace are being drawn back. The limit of social distance (in the Netherlands 1.5 meter) is guaranteed by creating safe distances between desks. And sometimes, a transparent screen is placed between desks.
Creating a safe social distance in the building
So, there are many solutions possible for creating a Covid-19 safe desk. But… employers spend a lot of time by walking through the building. Going to desk. But also, to meetings, company restaurants, toilets and yes, the coffee machine. It’s there when people cross each other. And from the art of their function, facility managers are walking through the building all the time: such as receptionists, cleaners, security, maintenance workers.
Some offices are using tape for walking routes. But soon, after it’s there for some hour’s employers don’t notice the tape anymore. Especially when you’re busy and your mind is on the coming meeting.
Covid Buzzer: alarm goes off at 1.5-meter proximity
How do you alert your employees that they are less than 1.5 meters away from each other? This simple solution to keep a safe distance between each other. Everyone in the office, factory or elsewhere where many people gather, wears a badge. As soon as the badge meets another badge within a radius of 1.5 meters, a warning signal follows. The badge is completely anonymous, there are no privacy issues involved.
The last months, due to Covid-19 factories, offices and institutions have been closed or been working on less power. Now, factories and offices want to open again. In the meantime, it is clear that Covid-19 will be with us for a long time. Employers want a safe as possible environment for their employees and visitors, as well as healthcare institutions and tourist and cultural providers. In addition, companies have a legal obligation to ensure a safe environment. And to take measures where necessary, so that the social distance is respected.
The Social Distance Badge is the device with which the 1.5-meter distance can be maintained. Simple, safe and without privacy issues
Work and recreation in times of Corona
For whom, what, why?
Factories
Construction and installation sites
Logistics: ports, warehouses
Transport (train, airports, busses)
Offices and Facility management
Healthcare
Touristic, sports and cultural sites and events
Factories
Factories and offices want to open again. Where offices can still choose by letting employees work from home, factories do not have this luxury. At assembly lines, many people are working together, concentrated to carry out their work. Then the 1.5 meter social distance may be ignored.
Construction and installations, logistics and transport
Employees are also unable to work from home during construction and installations. Many employees work side by side and close together. The employee will often need his focus to perform his work accurately and pay attention to other forms of safety, for example to prevent him from slipping or falling down. Employees can then forget to maintain the 1.5 meter social distance. The Social Distance badge helps to remind the employee to keep distance.
Offices and facility management
In the last months, many employees of offices have worked at home. But for social bonding and the well-being of employees, it’s important that employees are regularly present in the office. And not every office has the option to offer working from home.
Employees walk from workplace to company restaurant and meeting and back again. And meanwhile, facility managers walk through the entire building. Then it is important to keep the 1.5-meter distance, since 1 employee can spread the Corona-19 virus in the entire building.
Healthcare
For some groups, Covid-19 is particularly dangerous: the elderly and people who already have a condition. It is important for them that social distance is maintained. By clients, staff and visitors. In addition, some residents must be reminded to keep 1.5 meters.
Tourist, Cultural, Recreational, Sports sites and events
Visitors get mixed up, are enthusiastic and forget to keep their distance. Or are there visitors who do not take the 1.5 meter into account and thus pose a risk. With the Social Distance Badge, you can safely open again.
Guaranteed 1,5 meters distance
All employees (and customers or visitors) receive the SD badge upon entrance. This is worn around the wrist or neck. The SD Badge continuously scans its environment for other badges via a so-called Ultra Wide Band signal. This signal provides the most accurate distance measurement. As soon as 2 (or more) badges are less than 1.5 meters apart, they give a warning sound and/ or light signal. This allows everyone to keep enough distance. As soon as there are another safe 1.5 meters, the signal will stop.
https://www.advsolned.com/wp-content/uploads/2020/05/back-to-work-covid.jpg5801250ASN consultancy teamhttps://www.advsolned.com/wp-content/uploads/2021/07/asn_logo_red_met_tekst_helder-e1755353934770.pngASN consultancy team2020-05-24 15:00:132020-06-04 17:38:37Work and recreation in times of Covid-19: The Covid Buzzer
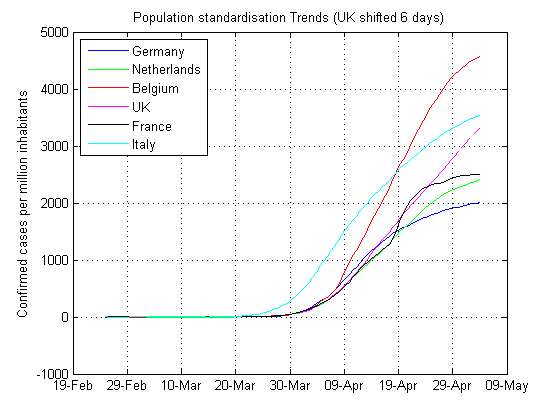
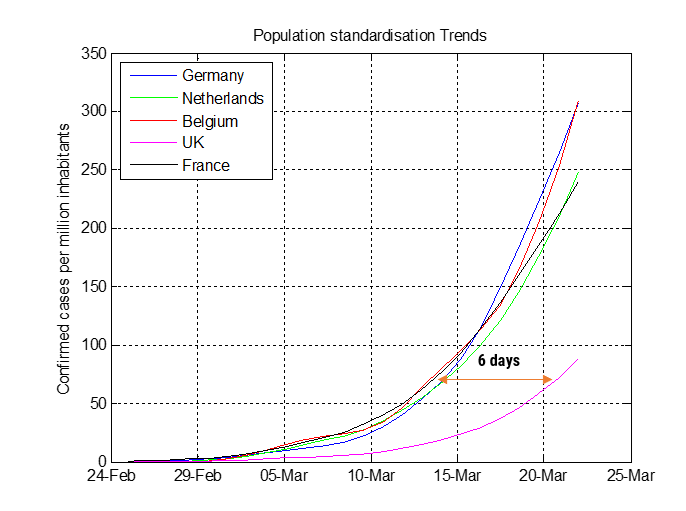
Continuing with our Analytics team study of the Corona virus on Western European countries, we present our findings for data up to week 19 (5 May).
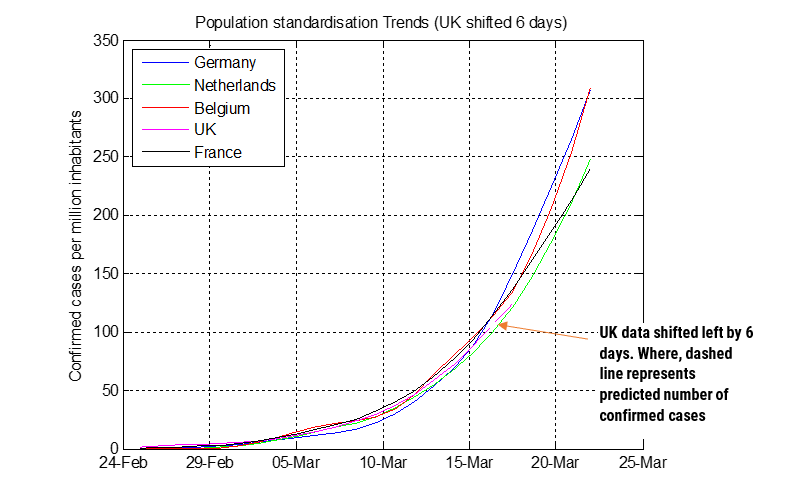
As discussed in previous articles, the UK had a one-week head start on its neighbours. Therefore, shifting the UK data left by six days, we obtain an interesting picture of the UK’s situation:
As seen, all countries with the exception of the UK report a slowdown in the number of confirmed cases. Where, France’s (black) data is clearly starting to level off. This suggests that the EU’s social distancing measures are having a positive impact, and that many EU countries may shortly be able to lift their lockdown measures. Although social distancing rules will still apply for the months ahead.
Since the UK left the EU back in January, they have had the freedom to define their own testing measures, which are not the same as other EU countries. This clearly changes the ball game. And as such, any objective comparison is flawed, as it is no longer possible to perform a like for like comparison based on the data alone.
As countries start to ease their lockdown measures, there is high degree of nervousness regarding a sudden increase in confirmed cases. In all cases, social distancing and better hygiene has been the key to containing the virus. However, new technology that respects people’s privacy is urgently required for intelligently enforcing social distancing and lift lockdown.
Intelligent social distancing enforcement
ASN’s track and trace and people tracking technologies are excellent privacy sensitive solutions for enforcing social distancing measures for both indoor and outdoor environments, achieving an unprecedented system reliability of 99.98% in factories, offices, restaurants, parks and schools. Please contact us for more information.
https://www.advsolned.com/wp-content/uploads/2020/03/covid19featuredimage-e1584964680979.jpeg630946ASN consultancy teamhttps://www.advsolned.com/wp-content/uploads/2021/07/asn_logo_red_met_tekst_helder-e1755353934770.pngASN consultancy team2020-05-06 10:43:502020-05-06 10:43:52Covid19: UK is the poor man of Europe, as EU searches for intelligent social distancing technology
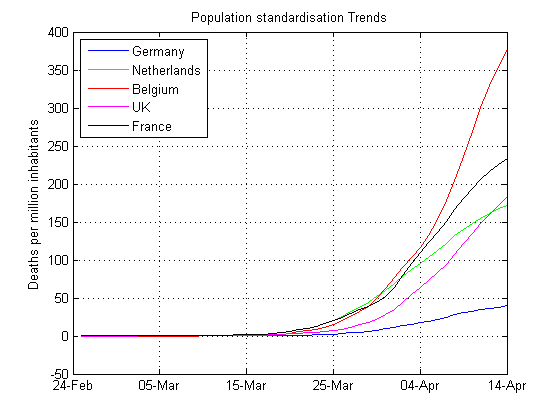
Continuing with our Analytics team study of the virus on Western European countries, we present our findings for data up to week 15 (14 April).
As discussed in our previous articles, in order to provide an objective comparison per country, the algorithmic results need to be standardised around the population of each country in order to produce a more accurate deaths per million inhabitants rate. The figure shown below summarises the results.
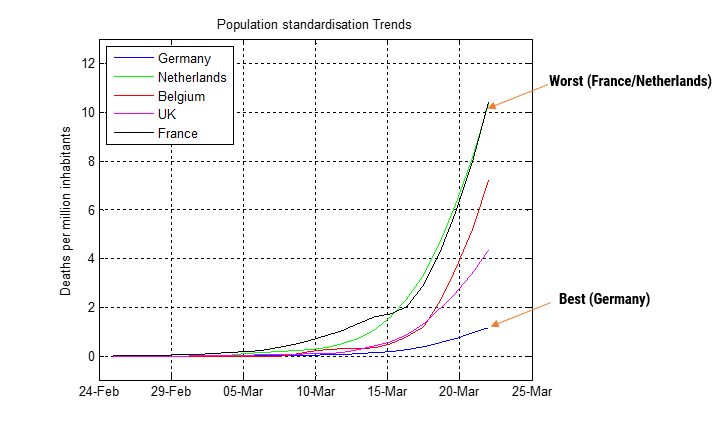
As seen, Belgium’s mortality rate (red) is significantly higher than any of its neighbours. Germany (blue) and the Netherlands (green) have the lowest mortality rates, and appear to be levelling off. This suggests that the Dutch and German governments testing, health care systems and social distancing strategies appear to be paying off.
It’s not completely clear why Belgium’s mortality rate is so much higher than its neighbours, but a possible explanation may be due to insufficient testing and the virus hitting various elderly care homes. We’ll follow Belgium’s progress over the coming weeks, and report our findings.
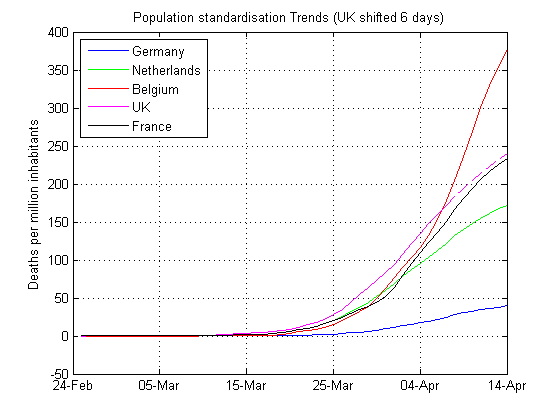
The UK
As discussed in a previous article, the UK had a one-week head start on its neighbours. Therefore, shifting the UK data left by six days, we obtain an interesting picture of the UK’s situation:
Applying a prediction model to the UK data (dashed magenta line), notice how the UK’s data follows France’s data. Although long term predication models should be viewed with a degree of scepticism (as there are too many unknown factors to consider), the prediction suggests that the UK’s mortality rate should follow France’s mortality rate.
The good news for the UK population, is that the emergency measures in place, appear to be working and are leading to a decline in deaths!
https://www.advsolned.com/wp-content/uploads/2020/03/covid19featuredimage-e1584964680979.jpeg630946ASN consultancy teamhttps://www.advsolned.com/wp-content/uploads/2021/07/asn_logo_red_met_tekst_helder-e1755353934770.pngASN consultancy team2020-04-16 13:38:422020-04-18 11:00:46Covid-19: Netherlands and Germany death rates stabilise, but Belgium still skyrockets
The Covid-19 virus has forced European governments to order millions to lockdown in the hope of limiting the spread of the virus, based on ‘expert scientific advice’. The latest recent review of WHO data by Dutch data modelling specialist, Advanced Solutions Nederland (ASN) reveals that the UK could of adverted strain on services and avoided a sharp rise in Covid-19 cases by taking advantage of being six days behind the infection spread in Northern Europe, but failed to put measures in place in time, due to flawed ‘expert’ predictions.
Central to government policies imposed are predictions being made from statistics that are essentially handling raw data ineffectively. Many models are based on raw measured values that are not adjusted for comparison with neighbouring countries, so called population standardisation, which can give a false perspective of the situation at hand.
– Director of Algorithms and Analytics, ASN, Dr. Sanjeev Sarpal
Ineffective use of modelling to predict virus trend
John Hopkins University (JHU) provide an open database of confirmed cases, deaths and number of recoveries, obtained from data from the World Health Organisation (WHO), various other health intuitions and governments. These datasets are broken down into countries and regions.
Analysis considered data obtained from the following five European countries populations: Germany (83 million), France (67 million) UK (66 million), the Netherlands (17 million), Belgium (11 million).
Our analysts found that by analysing the viral trend by doing a ‘like with like’ comparison of populations rather than the conventional method of non-standardisation, resulted in a totally contradictingset of results, implying that the UK governments response was not informed appropriately.
In order to provide an objective comparison per country, the algorithmics results were standardised around the population of each country in order to produce a more accurate deaths per million inhabitants rate. The figure shown below summarises the results.
Analysing the chart, it can be seen that all central countries considered herein all report first cases within days of each other, and have very similar contamination rate. The UK is the exception, as it is approximately 6 days behind mainland Europe.
By shifting the UK left by six days, we see that the UK also follows the same trend as its continental neighbours. The dashed line represents the algorithmic prediction of the number of confirmed cases for the next two days (short term prediction), which closely follows the other countries.
Thus, it can be concluded that despite the British government having advanced warning, they failed to adequately prepare themselves for the effects of the virus.
No magic long-term prediction model
There are a multitude of data modelling methods, each giving a different result depending on the interpretation required. For the Covid-19 virus, there is no ‘magic model’ that can be used to predict the long-term severity of the outbreak, as there are too many variables to consider, which are almost impossible to model and track as the pandemic unfolds.
External factors, such as emergency laws, increased public hygiene/diligence and better medical care facilities are but a few major factors that affect any long-term prediction model. These critical factors are generally not modelled when making a prediction model. The short-term prediction shown herein, was just for the next two days, but all prediction models must be viewed with a degree of scepticism, as it is not possible to model all of the unique circumstances that present themselves.
ASN’s data analytics team will be closely monitoring the development of the Covid-19 virus, and providing regular updates via our blog.
https://www.advsolned.com/wp-content/uploads/2020/03/covid19featuredimage-e1584964680979.jpeg630946ASN consultancy teamhttps://www.advsolned.com/wp-content/uploads/2021/07/asn_logo_red_met_tekst_helder-e1755353934770.pngASN consultancy team2020-03-24 12:13:182020-03-24 13:41:08Covid-19: UK had 1 week headstart, but failed to act
The Netherlands is regarded by the International Monetary Fund (IMF) as one the richest countries in the world, with high life expectancy, good infrastructure and a liberal society. The Dutch have historically been traders, learning multiple foreign languages and trading with the whole world – a practice that is still continued to this date. The Dutch love to travel, which may have been one of main factors for the Covid-19 virus gripping the Netherlands so severely.
The Covid-19 virus has led all European governments to effectively lockdown their countries in the hope of limiting the spread of the virus. Although some see this as a violation of their civil rights, the Dutch government’s ambition is to limit the spread of virus so that the health system can cope with a controlled flow of infections.
Population standardisation and carnival
New research from the University of Massachusetts,
suggests that
the median
incubation period (i.e. the time between exposure to the virus and the appearance of
the first symptoms)
for Covid-19 is
just over five days and that 97.5% of people who develop
symptoms will do so within 11.5 days of infection.
John Hopkins University (JHU) provide an open database
of confirmed cases, deaths and number of recoveries, obtained from data from
the World health organisation (WHO), and various other health intuitions and
governments. These datasets are broken down into countries and regions.
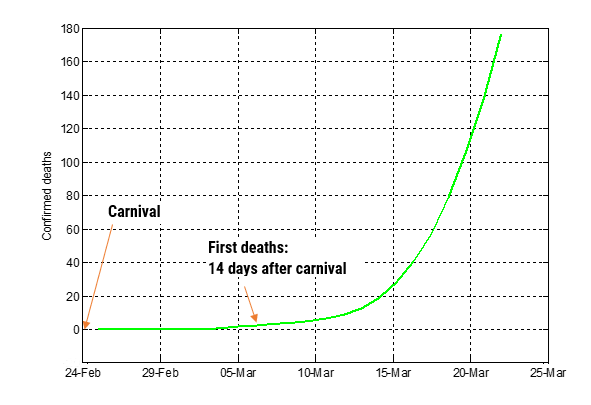
Applying our ANNA data modelling algorithms to the raw datasets provided by John Hopkins University (JHU), we were able to plot the mortality rate versus time for the Netherlands, as shown below.
Confirmed deaths for the Netherlands: source JHU database
Many models are based on raw measured values that are not adjusted for comparison with neighbouring countries, so called population standardisation, which can give a false perspective of the situation at hand.
The yearly Carnival festivals that takes place around the 23-Feb, attracts large crowds of people (shown on the right). This incubation period of approximately 12 days can be clearly seen in the data for the Netherlands, where the first deaths are reported around 7-March (14 days after carnival), suggesting that if not adequately treated in hospital, the patient will die within a few days.
Our analysis considered data obtained from the following five European countries (populations shown in parenthesis): Germany (83 million), the Netherlands (17 million), Belgium (11 million), UK (66 million) and France (67 million).
In order to provide an objective comparison per country, the algorithmic results were standardised around the population of each country in order to produce a deaths per million inhabitants rate. The figure shown below summarises the results.
Population standardisation trends: deaths per million inhabitants
Analysing the chart, it can be seen that when viewing the scaled dataset, the Netherlands (green) and France (black) have the highest mortality (death) rate, and Germany (blue) the lowest. France’s high mortality rate may be attributed to many foreigners visiting France for their winter holiday.
A disastrous combination of events
Analysing the
various news reports, the Brabant province in the South of the Netherlands was
a particular hotspot for the virus. Our findings as to the likely reasons why
the contagion rate in Brabant is so high can be attributed to a combination of
the following factors:
The yearly Carnival festivals taking place around the
23 February, which attract large crowds of people.
Frequent foreign travel of people working for large
international business, such as Philips and ASML.
School holiday.
People taking their winter holidays in France and
Italy.
Had carnival taken place several weeks earlier, the effects on the Dutch population may have very well been lower.
Another hotspot for the virus was Amsterdam, which like Brabant is a hub for international business, and a very densely populated region of the country.
Conclusions
The Covid-19 incubation period for the Netherlands is around 12 days.
When standardising the mortality rate population data per million inhabitants with surrounding countries, the Netherlands and France have the highest mortality rate of all of their neighbouring countries. A likely explanation of the explosive outbreak in the Brabant province of the Netherlands, is due to Carnival festival, the school/winter holiday and international business travel. France’s high mortality rate may be attributed to many foreigners visiting France for their winter holiday.
Despite Germany’s large population of 83 million, the data shows that the German government’s handling of the situation has been very effective indeed. The German health system boasts over 25,000 intensive care beds, and respiration equipment. Comparing this this Netherlands, which just has a little over 1,150 beds, and adjusting for the population differences – Germany still has more than 4.5 times more intensive care beds at its desposal.
In terms of
prevention: Germany’s National Association of Statutory Health Insurance
Physicians, reports that it has capacity for approximately 12,000 Covid-19
tests per day, which surpasses all other European countries.